
How Much Can You Expect To Earn In Stocks?
- zach5896
- Aug 11, 2025
- 5 min read
Summary/TL;DR
If you invest in stocks properly (ideally through low-cost index funds) and for long periods of time (periods longer than 10 years), then you can be confident that you will earn an average annual return of 10% (7% after inflation). This is based on distribution patterns observed over the past two hundred years which prove, beyond question, that long-term stock returns are not random, but are always traveling towards their long-term average. This fact has been observed in spite of political and economic developments and crises of all stripes, meaning it can confidently be assumed into the future as well.
Introduction
The answer to this question is the same as the answer to every good financial planning question: it depends. In the case of stock investing, the independent variables with the most weight behind them are which stocks you are investing in, and for how long.
Today’s post is dedicated to answering this question with all of its nuances.
Which Stocks?
The first variable of importance is the quality of stocks you are investing in. You likely won’t fare well picking individual stocks without a lot of research and a bit of luck, and even then you’re still overwhelmingly likely to underperform popular performance benchmarks. Fortunately, an excellent solution exists to this problem – you can invest in the benchmarks themselves in the form of index funds. Index funds track securities indexes and, because of the structure underlying their operation, will essentially do the stock picking for you. I’ve written about them here.
For example, the S&P 500 tracks the stock prices of the 500 largest publicly traded companies in the United States. It is market-cap weighted, meaning the more valuable a company is, the more of the index it will make up. There are also strict profitability and liquidity requirements that prevent companies experiencing a short-lived boom from entering the index. The moment that a company stops being one of the most successful, profitable, and liquid in the market, it will be replaced with one that is a better fit. Furthermore, index funds, unlike actively managed funds, have miniscule expense ratios – often in the neighborhood of 0.01%-0.1%. Finally, consider the fact that stock index funds, on average, outperform 95% of mutual fund managers!
Given these characteristics of stock indexes, we would expect their performance history, if charted logarithmically, to display as a positively-sloping straight line. This is exactly what we see, as can be seen in the chart below from famed economist Jeremy Siegel.

There are a few take-aways from this chart that are worth focusing on. First, as noted above, it is charted on a logarithmic scale, meaning the vertical axis increases exponentially instead of linearly. Researchers will chart datasets on a logarithmic scale because consistent rates of change display as a straight line. This additional piece of context drives home the remarkable consistency of stock returns over time, especially when compared with bonds, cash, and gold.
A second point worth nothing is that this chart goes back to the year 1801! Throughout this period, the United States has endured 37 recessions (including the Great Depression and Great Recession), 3 different federal banking systems, 3-4 (depending on how you count) different global monetary regimes, 9 periods of excessive inflation (defined as inflation of 10% or higher), 14 stock market panics, a Civil War, two World Wars, a Cold War with a nuclear power, a pandemic which shut down the global economy, 43 different presidents (19 Republican, and 15 Democrat, and 9 who belonged to other parties), has defaulted on its Federal Debt, has been on and off the gold standard, has had debt-to-GDP ratios as low as 0% and exceeding 100%, has been a developing nation, and the world’s global superpower. This chart therefore not only displays the consistency of stock returns (as measured by market-cap weighted indexes) over time, but also their astounding resiliency.
Time Horizon
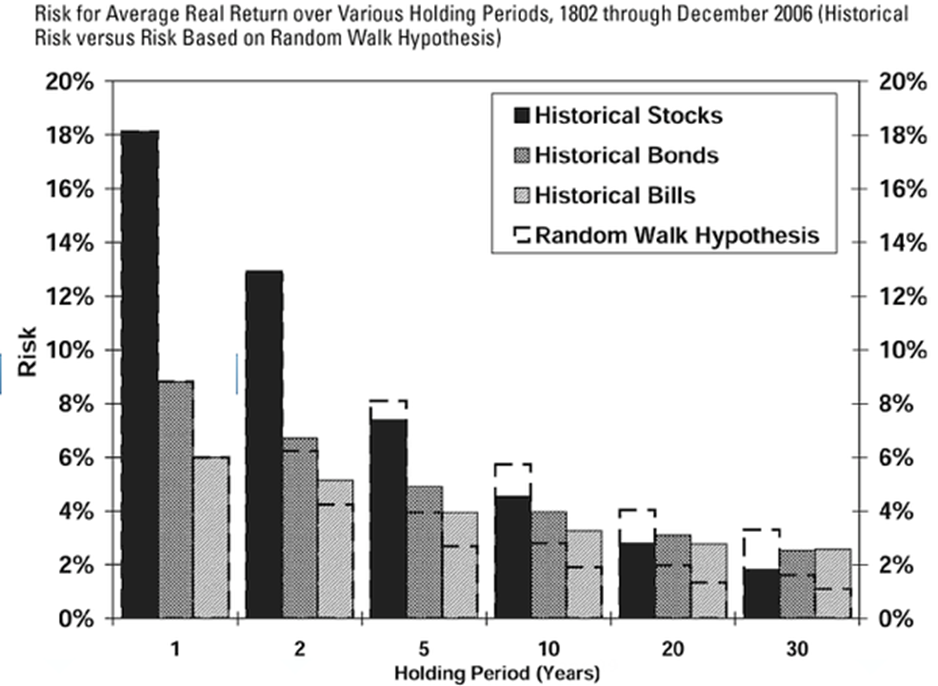
Almost everybody understands that investments in stocks are intended to be made for the “long run”. Efforts to “day trade” or market-time are all except certain to end in heartbreak (and an empty bank account). This is due to the distribution of returns historically possessed by stocks – shorter time frames have a much wider distribution of returns than longer time frames, which narrow considerably. In short, the longer you invest, the more certain you can be about the rate of return you will earn. This can be seen in the chart below, again from Jeremy Siegel.

Stocks returns posses an additional characteristic known as mean reversion – over long periods of time, they will return to their long-term average. This is highly significant because it means that stock returns are not random (an assumption made in an unfortunate amount of financial models). The opposite behavior is exhibited by bonds which appear to divert from their mean return over time, meaning they’re riskier to hold. Empirical evidence for this fact is shown in the chart below (this chart is through December 2006, but its conclusion would remain unchanged if it were updated through today).
So, What Can You Expect?
Now that we’ve placed our answer to the question posed by the title of today’s piece in its proper context, we may claim the following with a large degree of confidence: if one invests in stock index funds for a period of ten years or longer, they can reasonably expect to earn an average annual rate of return of 10% before inflation (or 7% after inflation). Of course, in periods of high inflation, the nominal return of stocks might exceed its historical average, but we would expect their after-inflation rate of return to remain around 7%. Furthermore, due to our observation about the mean-reverting behavior of long-term stock returns, it may be additionally stated that if an investor experiences a rate of return less than what has been claimed above over a decade, then the likelihood of them earning an after-inflation return in excess of 7% over the following 10 year period has increased substantially, and that they can therefore reasonably expect to earn an average after-inflation return of 7% over the total 20-year period.
There are an abundance of social media and YouTube influencers, annuity and life insurance salesmen, gold brokers, hedge-fund managers, and others who have built their audience by means of fear-mongering about an “overvalued” stock market, destined to crash at historic proportions at any moment. As chance would have it, they all have a product that will allegedly save your life savings from this crisis! At best, these individuals are ignorant of the facts discussed in today’s post. At worst, they are intentionally deceptive and manipulative. In either case, they have no business dispensing investment advice and are better off ignored.
The truth of the matter is that, at all times, the stock market is either over- or under-valued relative to its historic average, to which she is at all times returning. There is no conceivable crisis, barring nuclear Armageddon, which she has yet to have already endured and triumphed over, and none which has shaken her two-hundred-year history of consistency and resilience. If you invest in stocks correctly (ideally via indexes) for long periods of time (ten years or more), then you can comfortably exchange the boisterous clamoring of financial media pundits, social media influencers, and snake-oil salesmen, for the peace and confidence that accompanies the rational soundness of stocks for the long run.


